
The collection of code coverage data slows down the execution of tests. In a previous article , Sebastian Heuer and I explained how to reduce this slowdown when you use Xdebug.
Since we wrote that article, Joe Watkins released PCOV , a new PHP extension for collecting code coverage information. PCOV is significantly faster at collecting line coverage information than Xdebug 2. But where Xdebug can collect line coverage, branch coverage, and path coverage information, PCOV can only collect line coverage information. PHPUnit 8 added support for PCOV in February 2019.
Recently, Doug Wright did not only add support for branch coverage and path coverage to php-code-coverage
, the library used by PHPUnit for collecting, processing, and reporting code coverage information. He also performed some overdue cleanups and refactorings that make PHPUnit's --dump-xdebug-filter
and --prepend
CLI options that we discussed in our article superfluous. They are now deprecated and scheduled for removal in next year's PHPUnit 10.
Better information thanks to PHP-Parser
PHPUnit 9.3 was released on August 7, 2020 and used php-code-coverage 9.0 for its code coverage functionality. These releases brought branch coverage and path coverage into the hands of PHPUnit users for the first time.
In addition to new functionality, there were a lot of changes under the hood of php-code-coverage. Value Objects were introduced to replace arcane array structures that were hard to understand due to lack of type safety.
The change that is most relevant for this article, though, was the move to use Nikita Popov's excellent PHP-Parser library as the foundation for static analysis. We now use an Abstract Syntax Tree for analysing whether a line of code is executable or not, for instance. The result of this analysis is now more accurate than it was before and the code for this analysis is now much easier to understand and maintain.
The Visitor design pattern
is applied when analysing code with PHP-Parser: NodeVisitor
objects visit each node of a source file's Abstract Syntax Tree. Here is a list of the node visitors used in php-code-coverage 9.0:
-
CodeUnitFindingVisitor -
ExecutableLinesFindingVisitor -
IgnoredLinesFindingVisitor -
CyclomaticComplexityCalculatingVisitor -
LineCountingVisitor
We use these visitors to figure out which lines of code contain executable statements, which lines of code should be ignored (based on @covers
or @codeCoverageIgnore
annotations, for instance), which code units (classes, traits, functions) are declared in a source file, how many physical/comment/non-comment/logical lines of code a source file has, and what the Cyclomatic Complexity of functions and methods in a source file is.
Oh no. It's slow!
I expected that using PHP-Parser for static analysis in php-code-coverage would make code coverage analysis with PHPUnit slower. In the limited benchmarks that I ran before the release of PHPUnit 9.3, however, I did not see any significant slowdown. This is why I was surprised by the performance regression that was reported almost immediately after the release.
The obvious solution for dealing with an expensive operation (static analysis in our case) where the result only changes when the input (source files in our case) changes is caching. And so I concentrated the usage of PHP-Parser for source files that are covered by at least one test in the new class
ParsingCoveredFileAnalyser
. I then extracted the
CoveredFileAnalyser
interface from that class:
| interface CoveredFileAnalyser |
| { |
| public function classesIn ( string $filename ) : array ; |
| public function traitsIn ( string $filename ) : array ; |
| public function functionsIn ( string $filename ) : array ; |
| public function linesOfCodeFor ( string $filename ) : LinesOfCode ; |
| public function ignoredLinesFor ( string $filename ) : array ; |
| } |
Finally, I created an additional implementation that performs the caching,
CachingCoveredFileAnalyser
:
| final class CachingCoveredFileAnalyser |
| extends Cache implements CoveredFileAnalyser |
| { |
| private $coveredFileAnalyser ; |
| public function __construct ( |
| string $directory , |
| CoveredFileAnalyser $coveredFileAnalyser |
| ) |
| { |
| parent :: __construct ( $directory ) ; |
| $this -> coveredFileAnalyser = $coveredFileAnalyser ; |
| } |
| public function classesIn ( string $filename ) : array |
| { |
| if ( $this -> cacheHas ( $filename , __METHOD__ ) ) { |
| return $this -> cacheRead ( $filename , __METHOD__ ) ; |
| } |
| $data = $this -> coveredFileAnalyser -> classesIn ( $filename ) ; |
| $this -> cacheWrite ( $filename , __METHOD__ , $data ) ; |
| return $data ; |
| } |
| // ... |
| } |
ParsingCoveredFileAnalyser
is used directly when the cache for static analysis results is disabled. CachingCoveredFileAnalyser
is used when the cache for static analysis results is enabled. This class delegates to ParsingCoveredFileAnalyser
when a cache miss occurs and otherwise returns the cached result.
This appeared to be "good enough" and php-code-coverage 9.1.0 was released . Remember what I wrote at the beginning of this article? Caching makes things faster ... except when it doesn't.
A bad cache is worse ...
In mid-September 2020 I received an e-mail from Martin Völker, who works as IT manager and software developer at Crew United . By now I know that whoever works in the German-speaking film industry can't get past this network. Martin Völker approached me with a problem, but I'd better let him report it himself:
Organization of development work and test automation
The development work on our platform is organized in sprints. Improvements and new features are released approximately every month.
An API system based on PHP serves as backend. Secondary goals of the development work include the improvement of code quality – measured by numerous metrics such as CheckStyle reports, the PHP Mess Detector (PHPMD), static code analysis and code coverage reports. A sprint includes the goal that these metrics do not deteriorate – despite the growing size of the code base. In the best case the numbers reported by Checkstyle and PHPMD are lower at the end.
Each Git commit in the develop
branch goes through a chain of jobs on our Jenkins CI system:
- PHPUnit executes all unit and feature tests (within about five minutes) – currently about 8,300 tests; if there is no error ...
- the code is uploaded to two test servers – one for manual testing and acceptance of sprint features, one for automated testing and Behat front-end testing; this takes half a minute
- afterwards another job generates the described software metrics and with PHPUnit a code coverage report is generated – this is time-consuming and takes about 21 minutes in total; if there is no error ...
- the Behat tests for the frontend are executed – currently about 250 scenarios and nearly 4,000 individual steps; this takes about 40 minutes
Since all test steps – all except the deployment in step 2 – run against the same test system, they must run exclusively and block other Jenkins jobs for that long.
If the throughput time of a step or job increases significantly, this has a negative effect on the others. For example, it takes longer for newly implemented features to be available on the test system.
By the way, there are two or three other jobs on the Jenkins system that also have to run exclusively – such as automated tests with PHPUnit on the master
branch.
Another secondary goal is therefore to speed up the tests that are executed with PHPUnit. And thus also the faster generation of the code coverage report. Before changes can be pushed into the repository, the tests must be executed and run without errors. The developers get to feel changes in the runtime directly here.
How the runtime problems became noticeable
For September 2020 the update from PHPUnit 9.2 (with php-code-coverage 8.0) to PHPUnit 9.3 (with php-code-coverage 9.1) was scheduled. Since this requires changes to PHPUnit XML configuration files for code coverage, some time was reserved in the sprint for this. Thankfully, the new format is much clearer , the four or five files in the project were quickly changed.
The first surprise came after a first run on the Jenkins system. With the new versions, the time required had increased by about 90%. This could be reproduced on the local development computer.
First steps of root cause analysis
The tests on the development computer run on Windows. It would not be the first case where the cause can be found here. But also with a local Linux system the same picture had been found. The Jenkins system also runs on Linux. Everywhere a very similar behavior. So that was out of the question.
"I can't be the first and only one who has this problem" – a common thought. Besides, the new PHPUnit is already with the tenth subversion – 9.3.10. It will probably not be a teething problem either.
So you check bug reports on GitHub for PHPUnit and php-code-coverage. And lo and behold, the ticket 789 describes exactly our problem. So just do everything that is described there for the solution ... and problem solved!
It sounds very simple and logical: The library used for static code analysis was changed because the old one was hard to maintain. The new one – PHP-Parser – is cleanly built, but slower due to its concept. However, this is accepted with regard to the clearly predominant advantages.
To mitigate the effect – slower than before – there is the new cache for the results of the complex static analysis. You only have to set the folder for the cache in the configuration file. With the first run the cache is filled and from then on it runs so fast that only a small difference to the previous version occurs.
So the cache is activated and – as also described – PHPUnit is called with the new parameter --warm-coverage-cache
. After about one minute this was done on the development machine.
But then the next surprise came. Even during the second and third run to generate a code coverage report, the runtime was not lower – it was about 3 times higher with activated cache than without.
Cause study of the cache problem
Can you do something completely wrong if you only set a path for the cache files in the configuration file? Were there perhaps other processes running in parallel? Also a fourth and fifth attempt had – except for a few seconds deviation – the same result. PHPUnit needed almost one hour to generate the data for the report. Maybe this is now a Windows-only problem – could be. But on the Jenkins server the same result. The runtime trend in Figure 1 shows it clearly.
Figure 1: Runtimes of Jenkins builds at Crew United
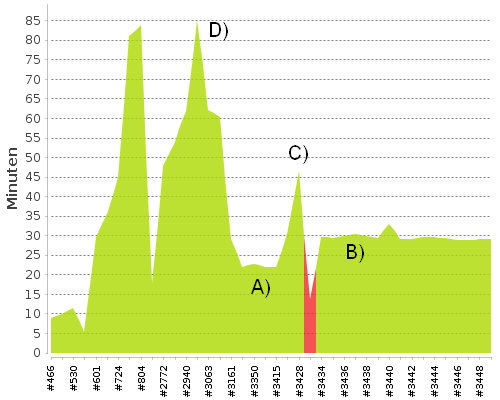
A. PHPUnit 9.2 with php-code-coverage 8.0
B. PHPUnit 9.3 with php-code-coverage 9.1 without cache
C. PHPUnit 9.3 with php-code-coverage 9.1 with cache
D. PHPUnit 9.2 with php-code-coverage 8.0 and Xdebug instead of PCOV
The next surprise was in the cache folder itself. Almost 38,000 files were in it. They are serialized PHP data. After a short analysis it could be seen that the namespace of the classes is also included. A first assumption was that maybe one cache file was created for each class or file from the vendor
directory. This would be a conceivable error. Code Coverage reports are only generated for the namespaces of Crew United; classes in the vendor
folder are not relevant. However, this assumption could be quickly disproved. There were no foreign classes in the files in the cache.
Contact with Sebastian Bergmann
At this point it was clear to me that I couldn't get any further and that the cause must be found "somewhere" in PHPUnit or php-code-coverage. A problem that nobody noticed before. Maybe it's simply the size of the project with a few thousand files. Here effects could be more obvious than in smaller ones. But a cache should always accelerate.
My thought was, now I just write him an e-mail. I know him from some big PHP conferences and the PHP user group in Munich. Him as a speaker, me as a listener. With a very high probability he does not know me, especially not by name. Will there be an answer and if so, when?
In the e-mail the three major problems were described:
- The approximately 90 % higher runtime compared to the previous version
- The tripling of the runtime with activated cache
- The amazingly large number of files in the cache
Also, concrete numbers from the PHPUnit runs – as shown above.
Two days later I actually had a reply in my inbox. About my questions the following feedback:
- The new PHP parser is slower, yes. But not known to this extent so far.
- With cache it runs faster. Also this behaviour is not known.
- Per PHP file in the project six files end up in the cache folder.
In addition, the offer to have a video conference with screen sharing – capped at one hour. Then I am supposed to show how the problems affect me.
I gladly accepted this unexpected offer. We made an appointment and I assured that I would prepare the material by the deadline. Concretely I had to offer:
- Invocations of PHPUnit with and without cache – the difference in speed was clearly visible when drawing the dots
- Profiling data (generated with Xdebug) with and without cache for the first 100 of the 8,300 tests
The video conference
After a short description of the project we went through the PHPUnit configuration file – no conspicuous features. Again the exclusion that this is a Windows-only problem.
The first astonishment occurred when we looked at the profiling data from the run with activated cache (see Figure 2).
Figure 2: Evaluation of profiling data in PhpStorm
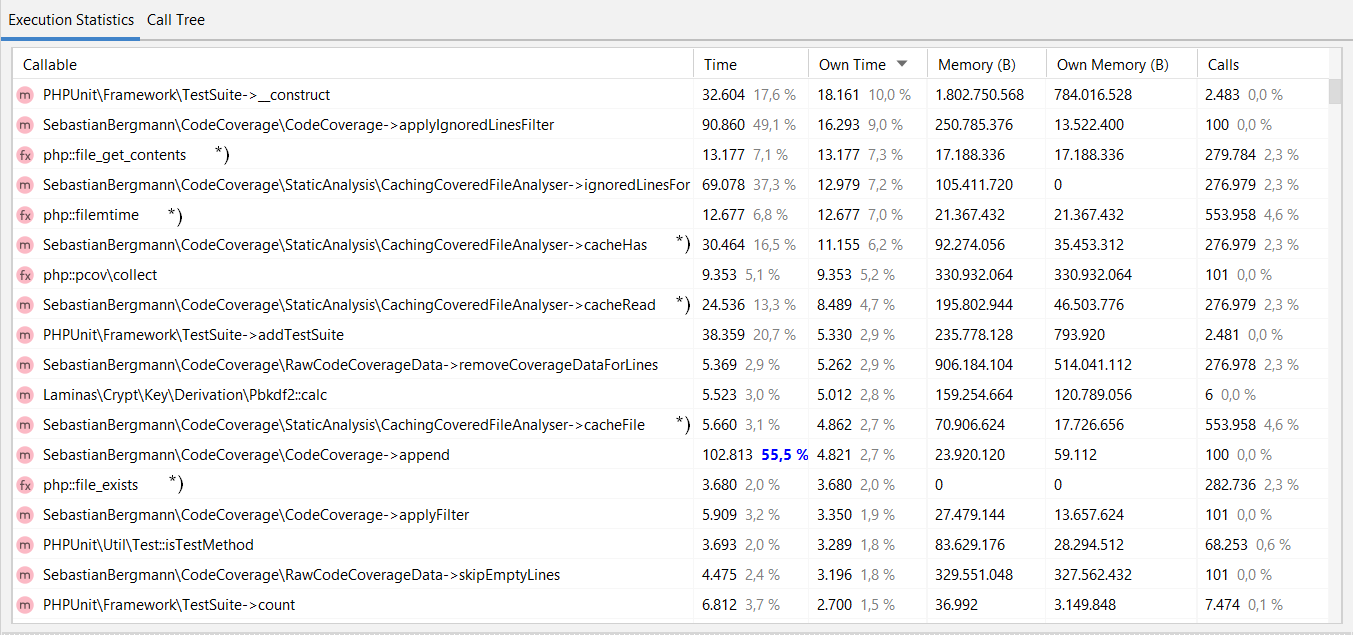
With PhpStorm, you can open data files created with Xdebug's profiler, the table is the view of it. In the column "Callable" you can see the names of the called functions, in "Own Time" you can see the run time percentage of the function. Striking function calls are marked with *). Why is "php:filemtime" with 7 % at the top? Why is "CachingCoveredFileAnalyse->cacheHas" with 6,2 % so far on top?
The suspicion quickly fell on a problem with the cache itself. Since PHPUnit and php-code-coverage are integrated in the project via Composer, we could make changes directly and check the effects. However, it quickly became apparent that the solution here was not even quickly achievable with two or three changed lines.
At that time, Sebastian Bergmann could not reproduce the problem on his own computer. We ended the video conference with the following plan:
- Sebastian Bergmann checks the conspicuously slow methods determined by profiling and rebuilds the cache.
- When the changes are ready, I get them into the project, run PHPUnit and give feedback.
The next hours – the success
According to the plan mentioned above, there were several runs according to the following pattern:
- Sebastian Bergmann: "I changed ..."
- Martin Völker: "Unfortunately I could not see any improvement yet."
The next day – very early around 06:15 – the feedback came:
- I have again eliminated a few I/O operations
- I can now reproduce the problem
So once again get the latest code of PHPUnit and php-code-coverage into the project and ... it was actually done. Also my turnaround times with cache were better.
My answer to Sebastian Bergmann: "The latest optimizations work, speed up the throughput for me and solve the cache problem. Thanks a lot!"
At this point I would like to thank Martin Völker for the nice video conference as well as the good cooperation in solving this problem.
So what caused this?
The cause for the significant performance regression reported by Martin Völker was two-fold. The result of the static analysis performed by ParsingCoveredFileAnalyser
was stored in five cache files per source file by CachingCoveredFileAnalyser
. Therefore, five I/O operations were required for reading the cached result of the work performed by ParsingCoveredFileAnalyser
. But wait, it gets worse. The classesIn()
, traitsIn()
, functionsIn()
, and linesOfCodeFor()
methods are only called once per source file. However, the ignoredLinesFor()
method is called once per covered source file after each test. The original implementation of the cache read the information for ignoredLinesFor()
over and over again from the cache. In hindsight it is obvious that this was a very bad idea.
The implementation of CachingCoveredFileAnalyser
now looks like this:
CachingCoveredFileAnalyser.php
. The information is no longer stored in five separate cache files and the same information is no longer read multiple times from disk.
While working on this, I learned that
file_exists()
is up to a hundred times slower than is_dir()
or is_file()
. While I was not able to measure any difference in performance where file_exists()
was used in the code of php-code-coverage, I still replaced calls to file_exists()
with calls to is_file()
.
Last but not least
The first implementation of the cache for the results of static code analysis was too naive. Neither the clean design, CoveredFileAnalyser
interface with the implementations ParsingCoveredFileAnalyser
and CachingCoveredFileAnalyser
, nor the automated tests could help to expose this naivety. Finally, the automated tests could only ensure that the cache was working. Of course, the tests did not check the performance quality goal. Only increased testing in the sense of benchmarking could have uncovered the problem.
Martin Völker wrote earlier:
My thought was, now I just write him an e-mail. [...] Will there be an answer and if so, when?
Of course, you can contact me by e-mail. And, of course, I try to answer every e-mail that reaches me.
Problems with PHPUnit (or other Open Source projects) should primarily be reported in the appropriate issue tracker. However, sometimes it's not easy or even possible at all to report a problem there in public. For example, if the problem is only reproducible in your own environment or only with your own code, which you cannot or do not want to share publicly. In such cases I always offer what I also offered to Martin Völker and what he described in detail above.
By the way: for problems that are not directly related to my Open Source projects, I can also help.